The RTMP Service consists of monitoring the quality of the RAN network through the monitoring of KPIs and alarms in real time. It includes:
- Real Time detection of degradations,
- Automatic identification of top-offenders for each degraded KPI
- Analysis of possible degradations in real time
Using 3dB RTM Tool allows to guarantee the quality of service of the network in real time in an optimal way. The service ensures the fulfillment of the expectations of the final customer.
3dB RTM Tool main features:
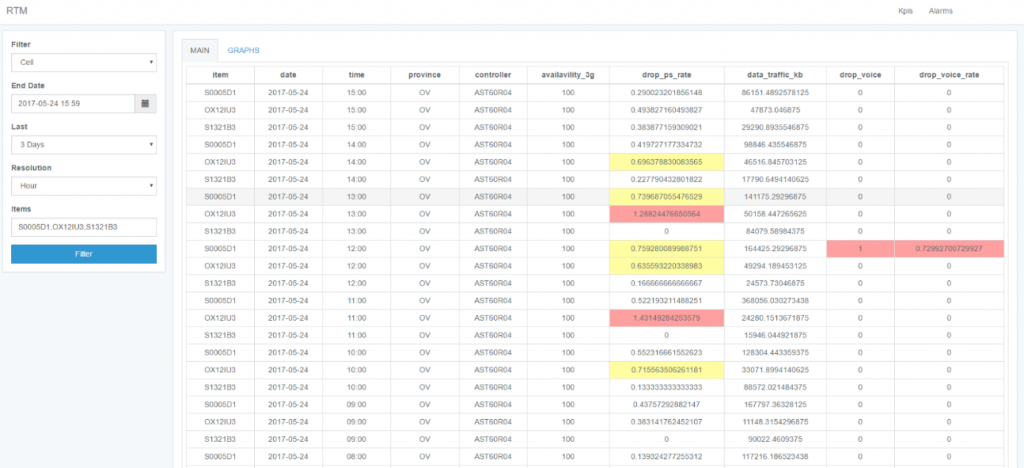
- Real Time Visual presentation of data: for the real-time monitoring, the possibility of visual presentation of the degradations, both at the Controller level, clusters and cell, is fundamental. It greatly facilitates the detection of degradations, reducing the resolution time of the same.
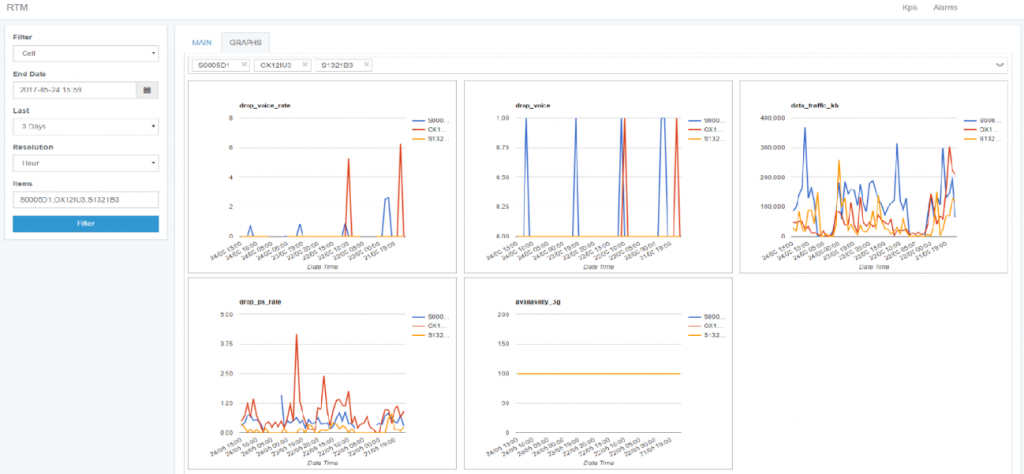
- Visual presentation of graphical data: for real-time monitoring, it is also important to visualize graphical degradations, both at the Controller, clusters and cell levels. This option makes it easy to monitor degradations by speeding up their resolution.
- Geolocalization of degradations: The geolocation of the degradations, to facilitate finding the cause of the degradation and to detect massive degradations and affected cells.
- Online Monitorization of KPIs, whole network, real time
- Minimum delay of obtaining KPIs (<30 min): 3dB RTM has a delay of less than 10 min for ROP processing. To this delay it is necessary to add the time of download of the data from the client (Operator) to RTPM server (depending on the available bandwidth). A reference time for this download may be around 10 min.
- Definition of alarm thresholds: it has alarm thresholds for degradations of absolute and relative configurable KPIs.
- The RTPM tool has the ability to store and display the existing alarms of each active node in the network
- Degradation detection: the tool detects and visually reports any degradations in the network.
- Notification of degradations by mail / SMS : it is also very important that serious degradations are reported to all groups that can take part in the solution of the same. The degradation level must be configured for the messages and distribution lists of the messages.
- Worst Cells presentation: presentation of the worst cells (top offenders) calculated for each degraded KPI in each controller.
- History of degradations: history of past degradations (so that, in case of being recurrent, actions can be taken), as well as a list of ongoing degradations, with the time they are open and the nodes impacted, as well as actions taken to resolve them.
- History of active alarms: A history of the active alarms happened in the past is stored so that, in case of being recurrent, actions can be taken.
- Breakdown of degradations with alarms in the network: 3dB RTM allows to query the alarms in the network for the degraded nodes, so that if a degradation is detected, the alarms existing in the affected nodes are automatically verified.